©
Electrical Research and Development Association (ERDA)
.
All rights reserved.
Designed and Developed by
Trizone India
A. Root Cause Analysis (RCA)
i) Root Cause Analysis of Failed 400 kV Polymer Composite Insulators
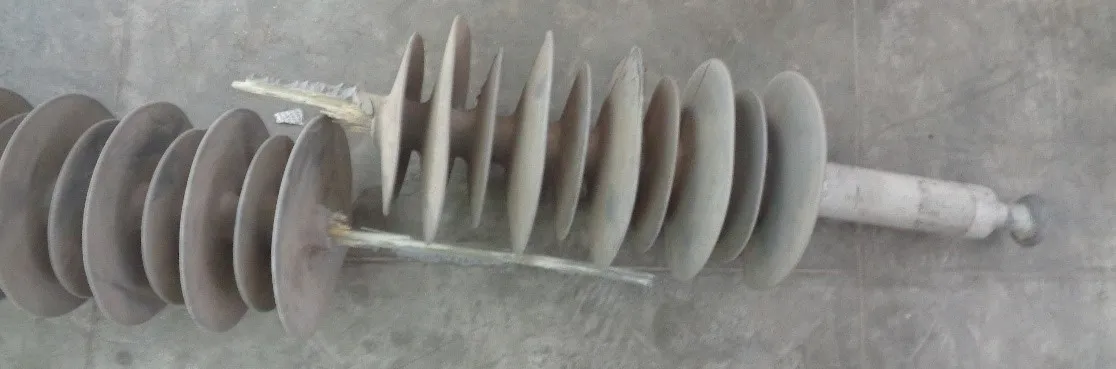
One failed polymer composite insulator (Silicone Rubber Insulators) from a 400 kV transmission line was received for Root Cause Analysis (RCA) along with a working insulator. The insulator failed after 12 years of service life on a transmission line located in a salt pan area. The failed insulator was broken at the line end of insulator with the damaged composite rod coming out of the silicone rubber housing. Some punctures were also observed in the silicone rubber housing of the failed insulator.
SEM evaluation of the broken glass fibres from the composite rod did not indicate brittle fracture. Stripe test on the working insulator and tower end of failed insulator indicated good interfacial adhesion between silicone rubber housing and composite core rod. Both the failed and working insulators were covered with layer of dust. Evaluation of the pollutants using NSDD and ESDD indicated heavy pollution severity. EDS analysis of the dust indicated presence of iron and salt (NaCl) particles. Presence of salt particles helps in the leakage current and dry band arcing. Presence of Nitrogen compound also indicated electrical discharges. The composite core rod of the insulator showed number of micro-cracks and the glass transition temperature of the composite core rod was relatively low. Combination of the pollution and insulator weakness played a role in the failure. It was advised to monitor the insulators in the affected region as the working insulator also showed initiation of degradation activity.
ii) Root Cause Analysis of Failed Bull Gear Tooth
Root cause analysis of failed bull gear tooth was carried out for one of the gear manufacturer. Two tooth of bull gear were found damaged during overhaul inspection at the installation site after tripping of gear 2 times due to spike vibrations during operations. The detailed analysis of failed bull gear was carried out by visual and NDT examination, fractography examination, microstructural analysis and mechanical testing.
The key points observed from the analysis are as below:
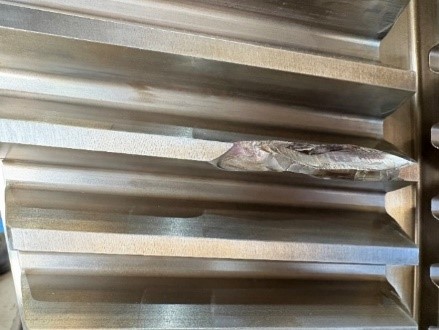
Visual examination of bull gear indicated failure of two tooth on loading side of tooth towards direction of rotation. Other mating pinion gears coupled to bull gear observed in good condition, without any damage. Two damaged screw bolts of nearby oil deflector plate were also received along with broken tooth pieces.
NDT analysis of gear by MPI and radiography did not show any surface or internal cracks in the gear tooth material. Microstructure (tempered martensite/bainitic) and hardness (60 HRC) of failed tooth surface observed as per requirement. Inclusion analysis showed presence of complex inclusions Al2O3-MgO-CaO-(Ca,Mn)S for failed and un failed tooth, but not in high density to cause the failure. Therefore, no abnormality observed for chemical composition, microstructure, hardness and integrity of tooth material.
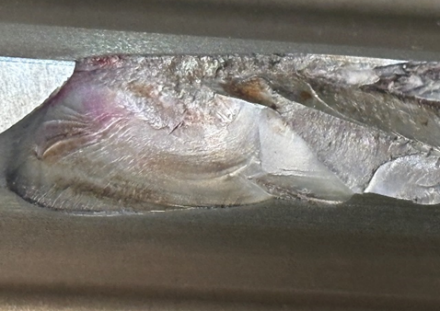
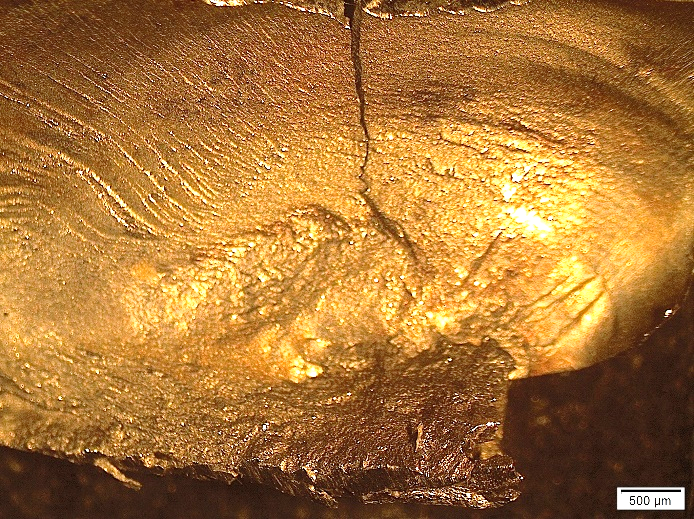
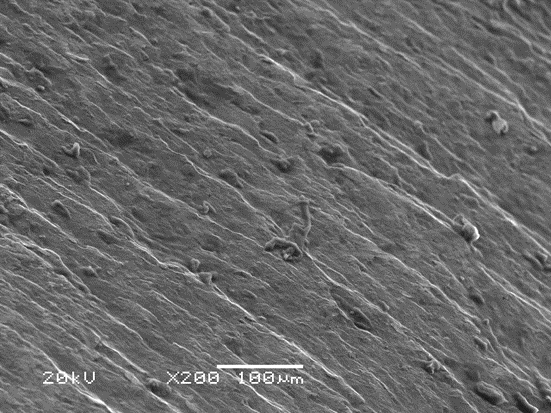
Fractography analysis of both broken tooth indicated the presence of fatigue progression marks. It confirms the fatigue failure of bull gear teeth during operation. Broken bolt of oil deflector plate also indicated fatigue failure under influence of vibrations. It also showed presence of two damage marks on head located opposite to each other. The damage appearance indicated multiple parallel line as observed on top land surface of tooth (Figure 2) which indicates the possibility of impact of loosened bolts on top land of tooth.
From detailed analysis following mentioned inferences were drawn –
As the failure of gear teeth occurred due to fatigue, most likely initiated from the impact of loosened bolt on top land of tooth,
Figure (ii) (a, b) Broken tooth of bull gear. (c) Optical stereo microstructure (d) SEM microstructure. It indicates the crack initiation at face of tooth and fatigue progression marks propagating in the loading direction of tooth.
B. R&D Completed Project
i) Condition Assessment of Railway Wagon Wheel through Phased Array Ultrasonic Testing (PAUT)
Objective: The primary objective was to validate PAUT as an effective Non-Destructive Testing (NDT) method for identifying internal defects in wheel of Railway wagon, thereby contributing to enhanced operational safety and reliability of train.
Methodology and Validation: The PAUT assessment was carried out during a site visit to a Loco Shed in the Vadodara region.
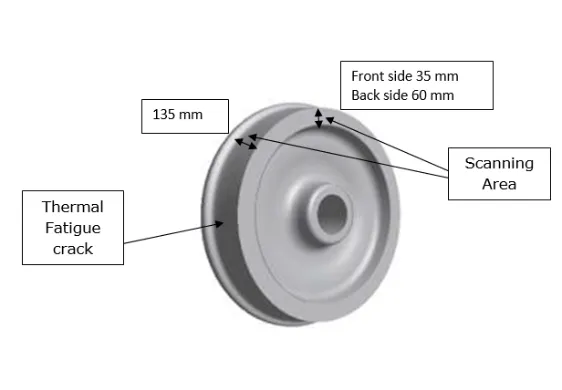
Inspection Area Focus: The PAUT probe focused its scan on the Wheel Rim, as this area remains in direct contact with the railway track and has the highest probability of flaw development. This critical area is visually represented in Photograph No. 1 (The Railway Wagon Wheel Rim).
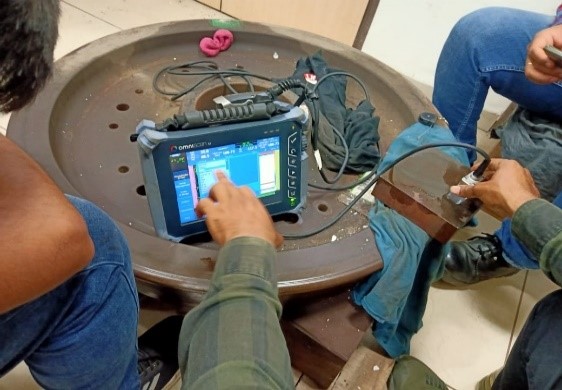
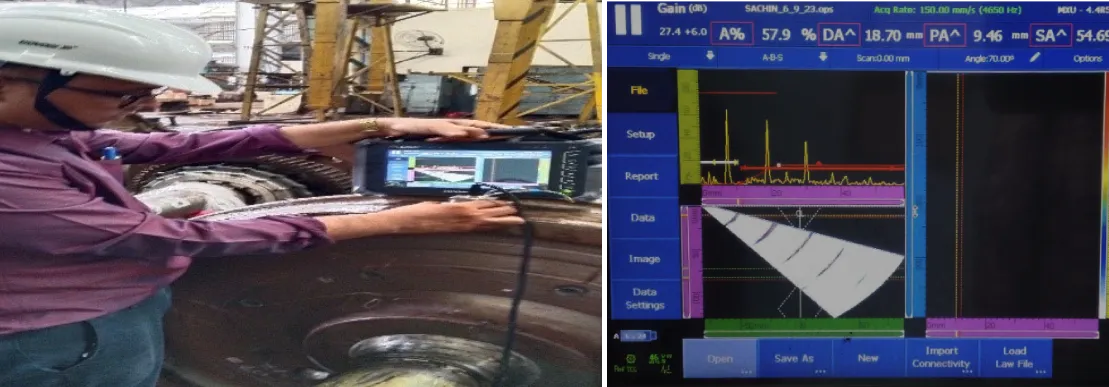
Equipment Calibration: The PAUT machine was rigorously calibrated on a standard calibration block to accurately set parameters including range, gain, ultrasound velocity, probe and wedge. The calibration process setup is shown in Photograph No. 2 (PAUT Machine Calibration).
Procedure: A specific program setup was then prepared based on calibration data, and the actual PAUT scan was performed sequentially on three distinct wheel conditions: new, used, and trimmed.
Detailed PAUT Results and Findings
The PAUT data analysis successfully diagnosed the condition of the different wagon wheels:
| Wheel Condition | PAUT Findings (As per Photograph) | Significance |
|---|---|---|
| New Wheel | No defect indication observed. (See Photograph No. 3) | Established a clear baseline signature for a fully sound wheel structure. |
| Used Wheel | Minor scratch mark indication observed. No major internal defect. (See Photograph No. 4) | Confirmed the wheel was structurally sound despite minor surface wear from operation. |
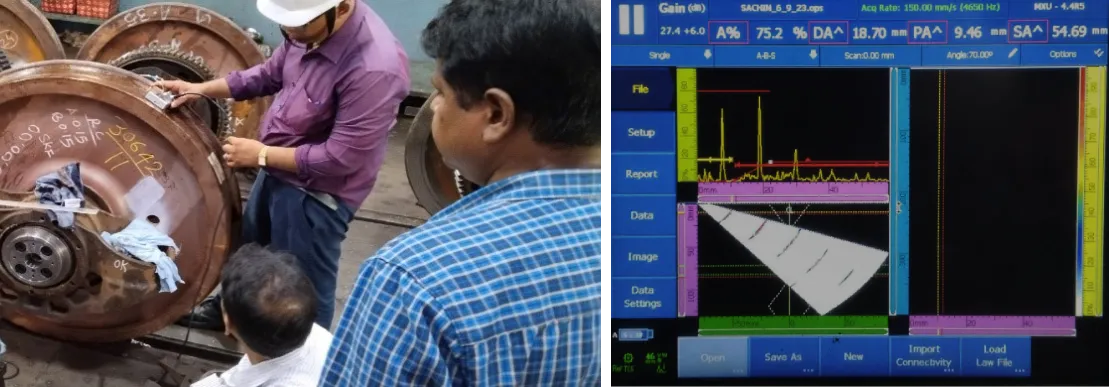
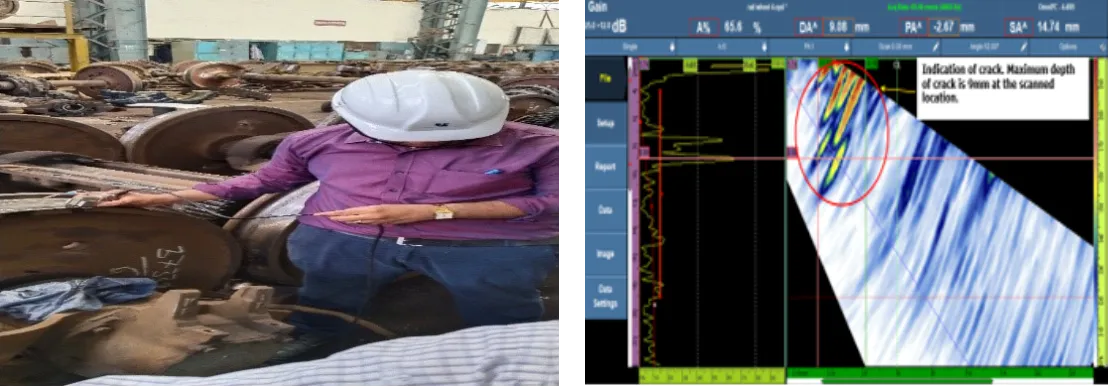
| Trimmed Wheel | Internal Fatigue Crack clearly observed. (See Photograph No. 5) | Critical finding: Demonstrated PAUT’s capability to detect severe internal defects (fatigue crack) that could lead to failure, validating its utility for maintenance decisions. |
Conclusion
The comprehensive study definitively validates Phased Array Ultrasonic Testing (PAUT) as an indispensable and highly effective advanced NDT technique for the condition monitoring of railway wagon wheels. The most significant finding is the clear detection of a critical internal defect like crack in the trimmed wheel (Photograph No. 5), which underscores PAUT’s superior capability in failure prevention. The project confirms that incorporating PAUT into regular maintenance schedules is crucial for the proactive diagnosis of sub-surface faults, substantially enhancing the safety, reliability, and lifespan of the Indian railway rolling stock.
C. Testing / Simulation Study Performed for Customer
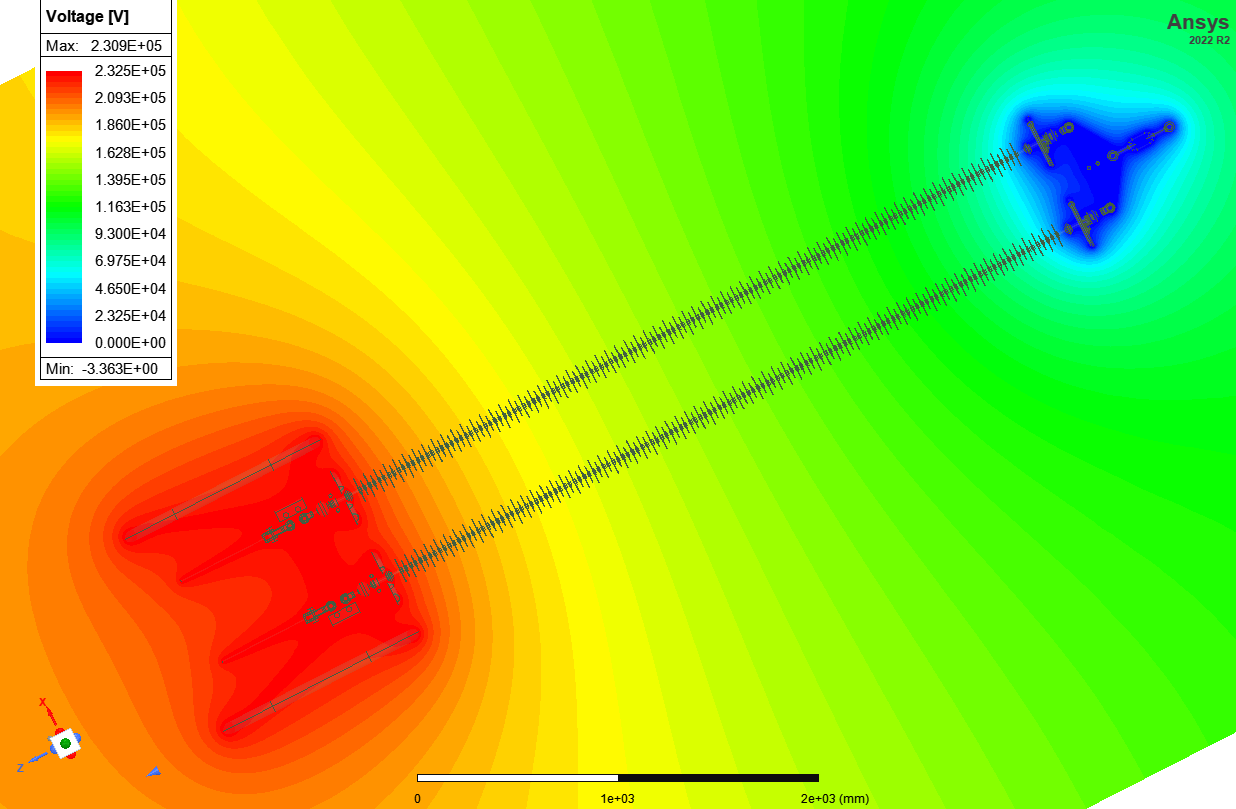
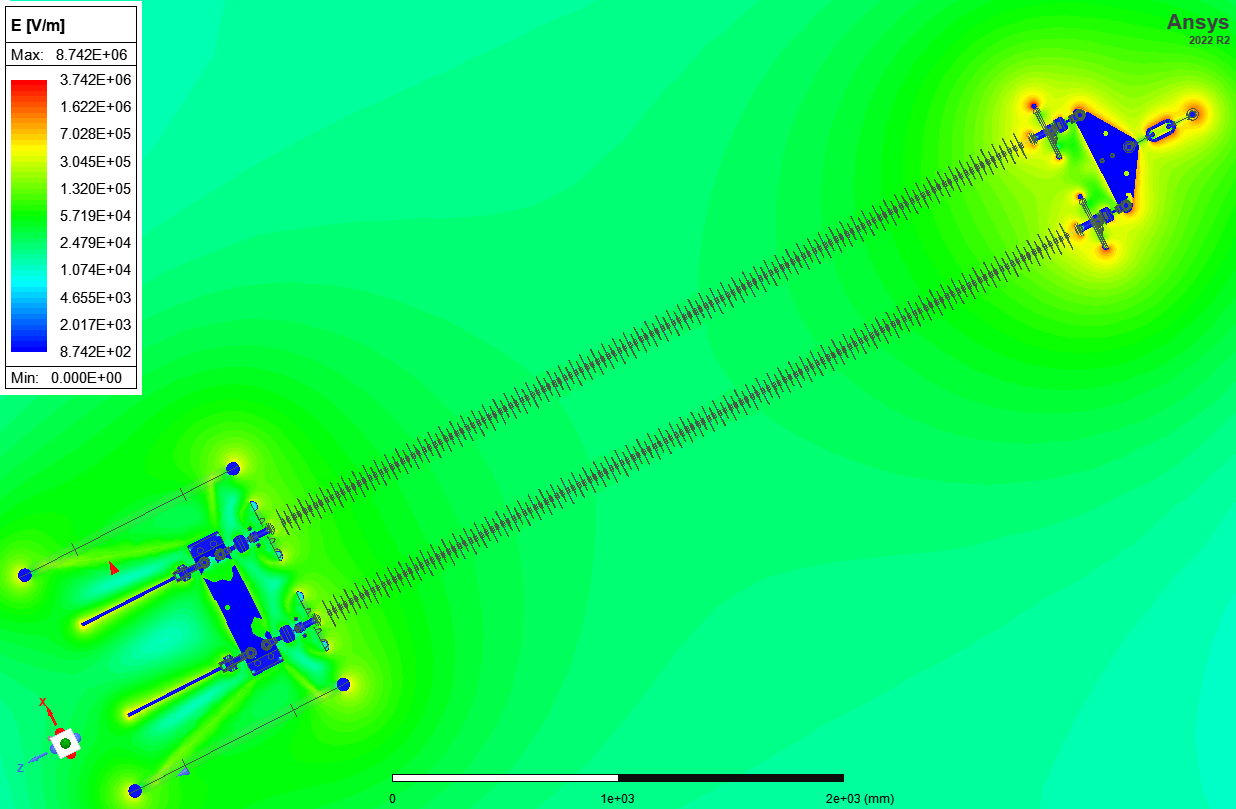
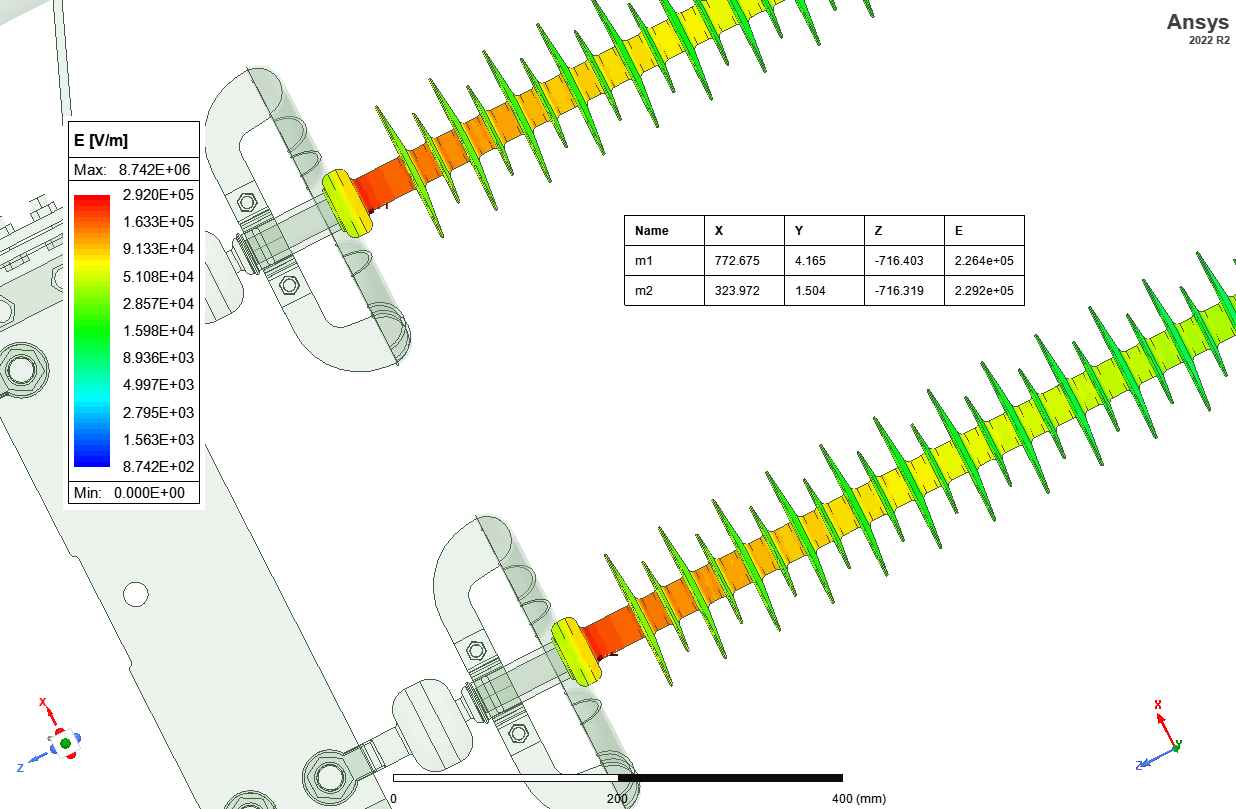
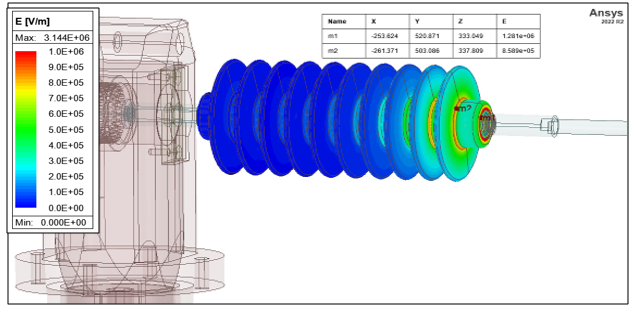
i) Electrical Field Analysis of 400kV -160kN silicon Composite Insulator by FEM approach:
A Silicon Composite Insulator Design and Analysis study was undertaken for the client by using the Finite Element Method Approach. Specifically, the work involved detailed electrostatic field mapping (Electric Field and Voltage) at RMS Voltage level on Silicon Composite Insulator. ERDA has performed this study by using ANSYS Maxwell 3D software and provided the result of Electric field Strength at various locations across the Insulator profile.
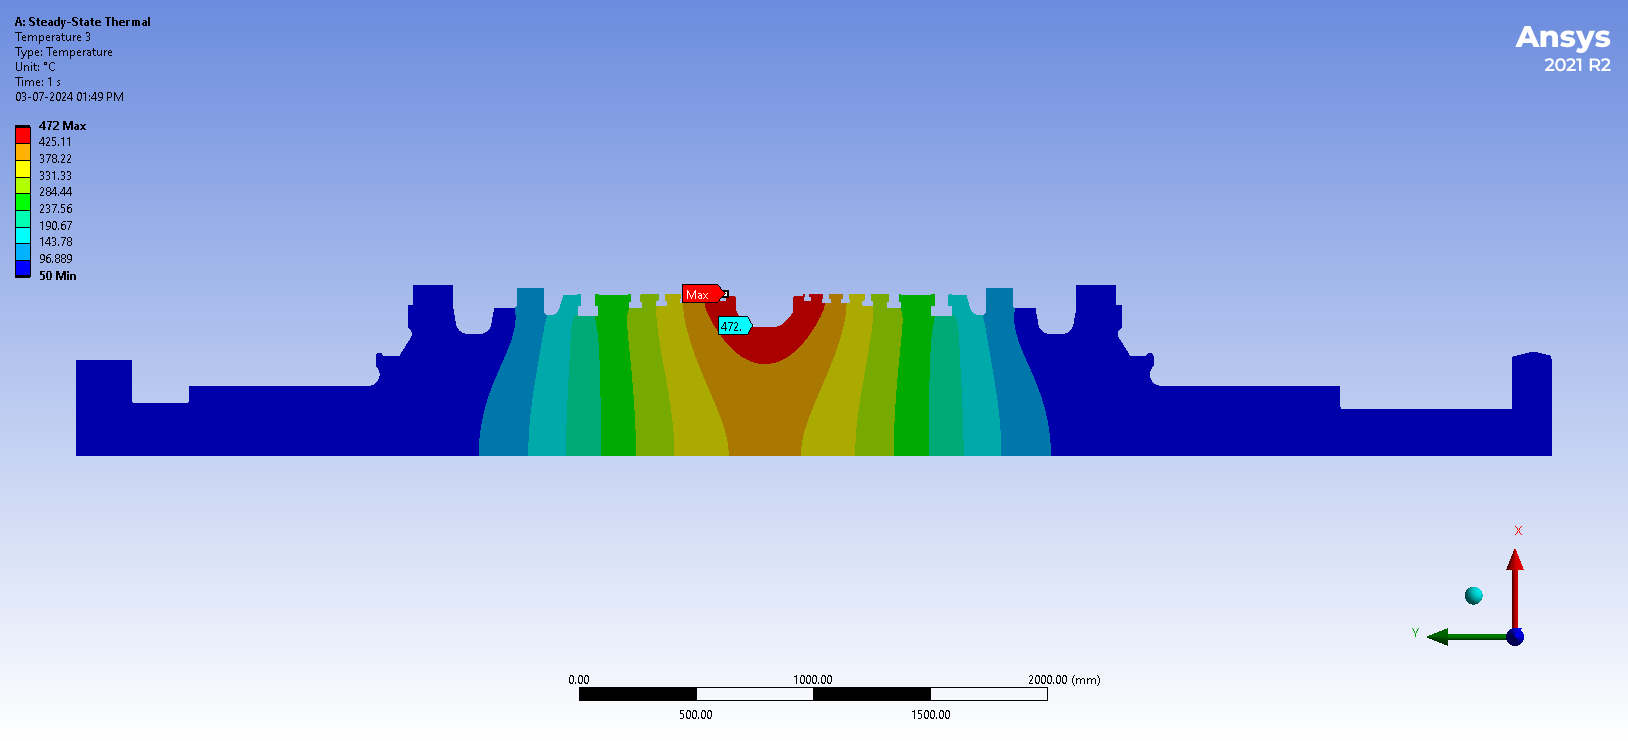
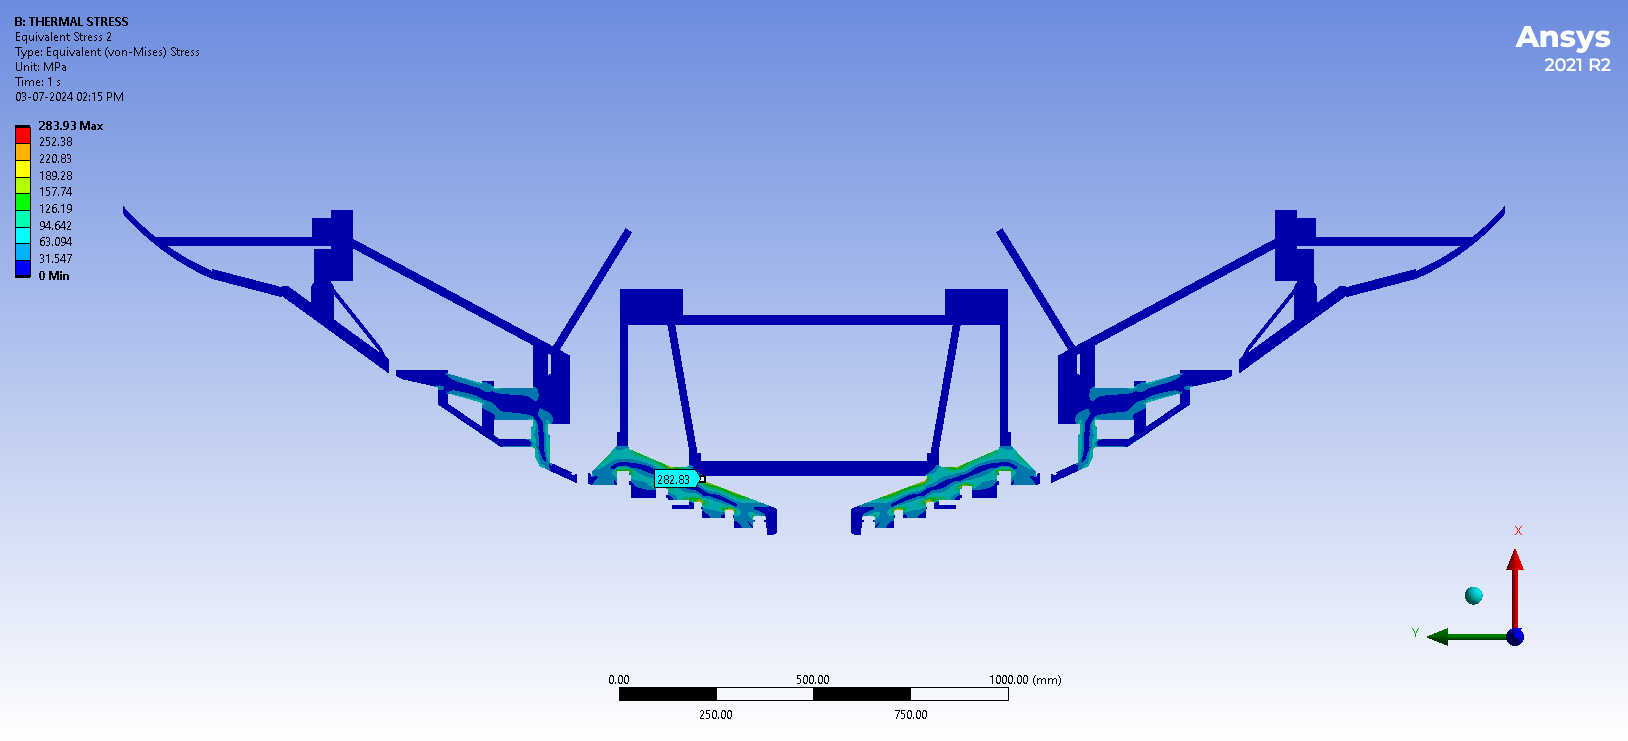
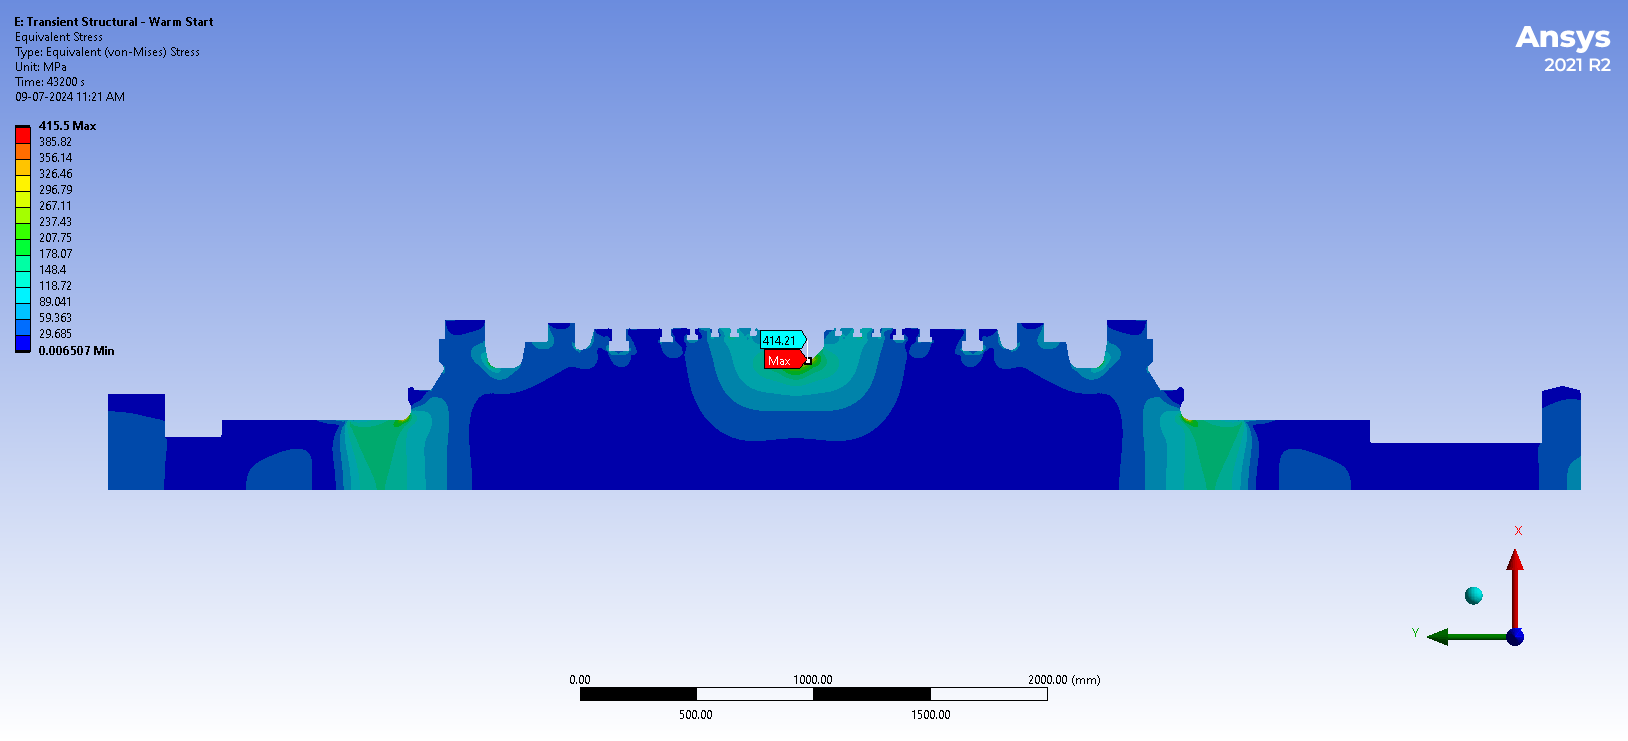
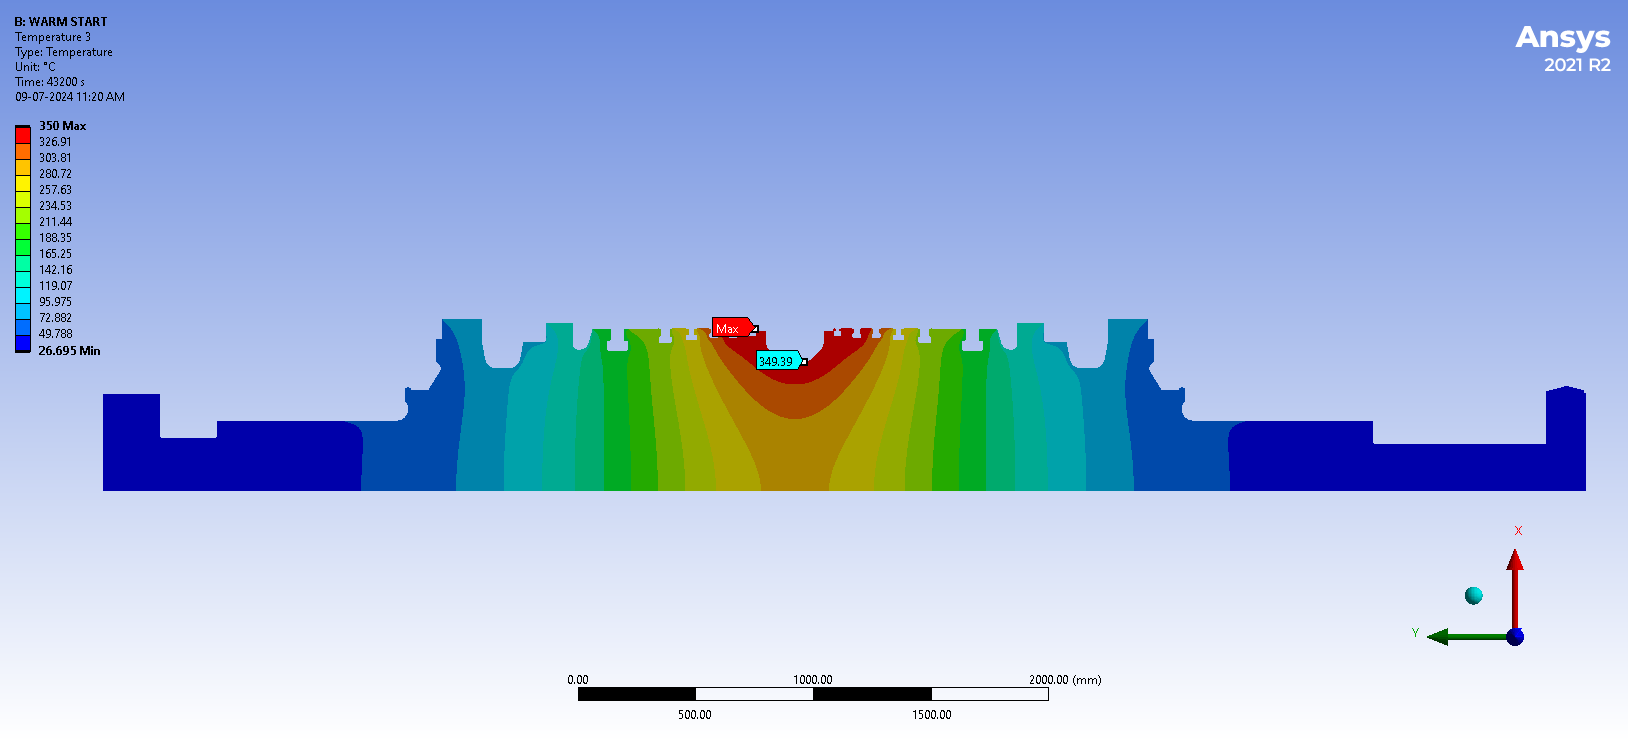
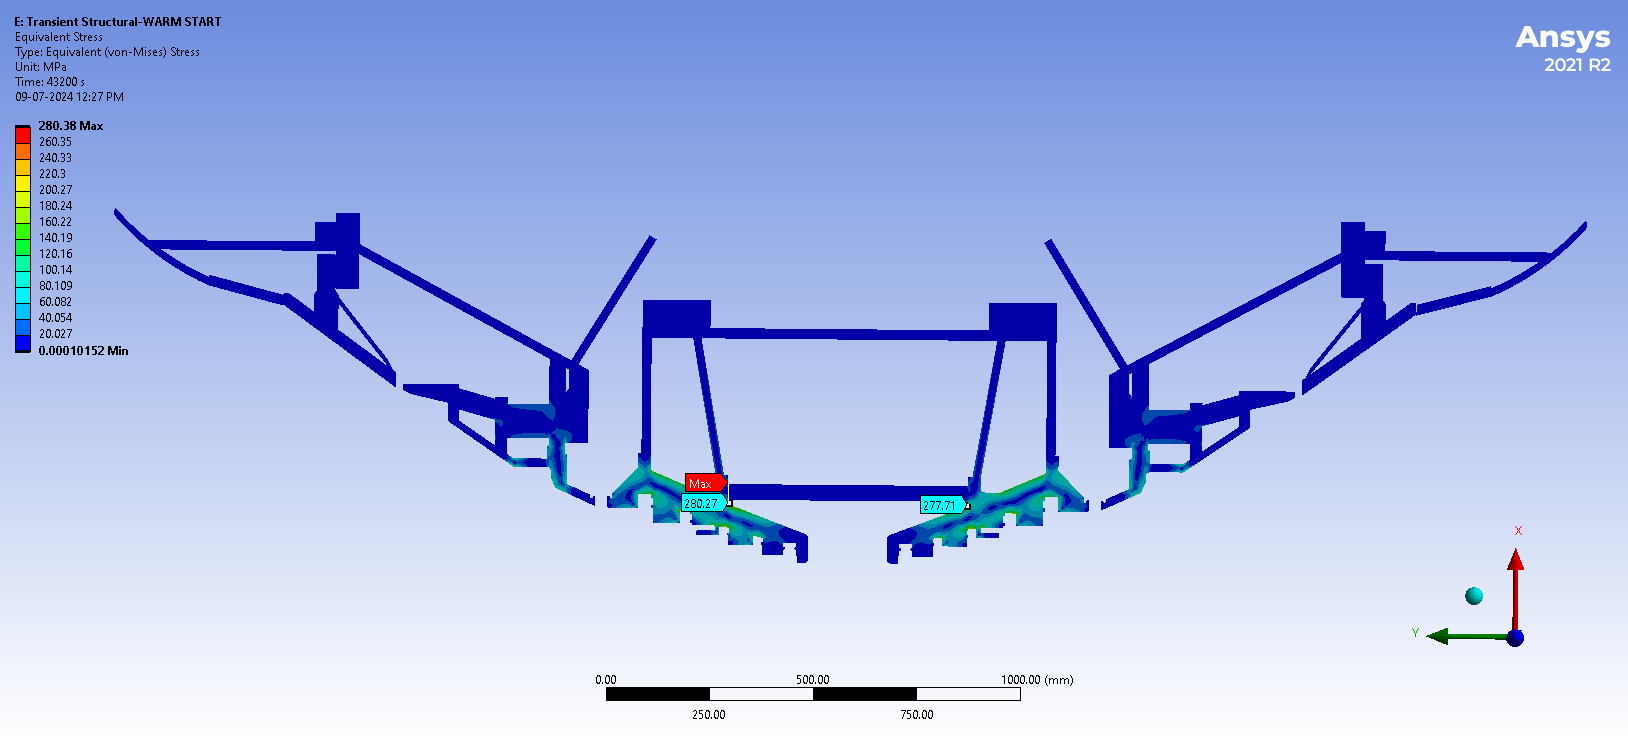
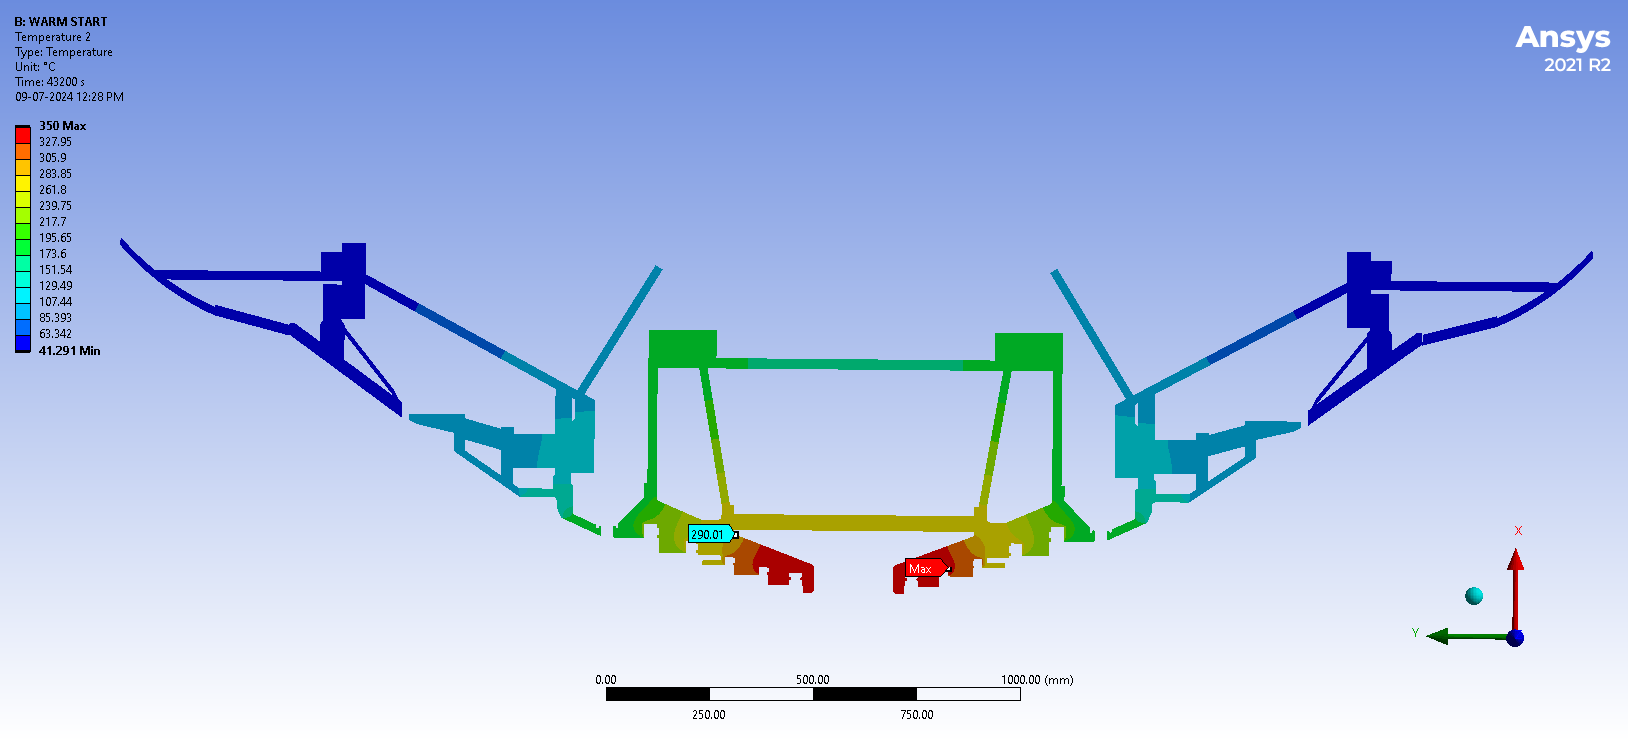
ii) Residual Life Assessment (RLA) of 210 MW Low Pressure Turbine by FEM Approach:
FEM Analysis of Low Pressure Turbine Rotor and casing of 210 MW Thermal Power Plant was undertaken for client to determine remaining life in creep and fatigue. ERDA performed this study by using ANSYS Workbench in both static and transient condition.
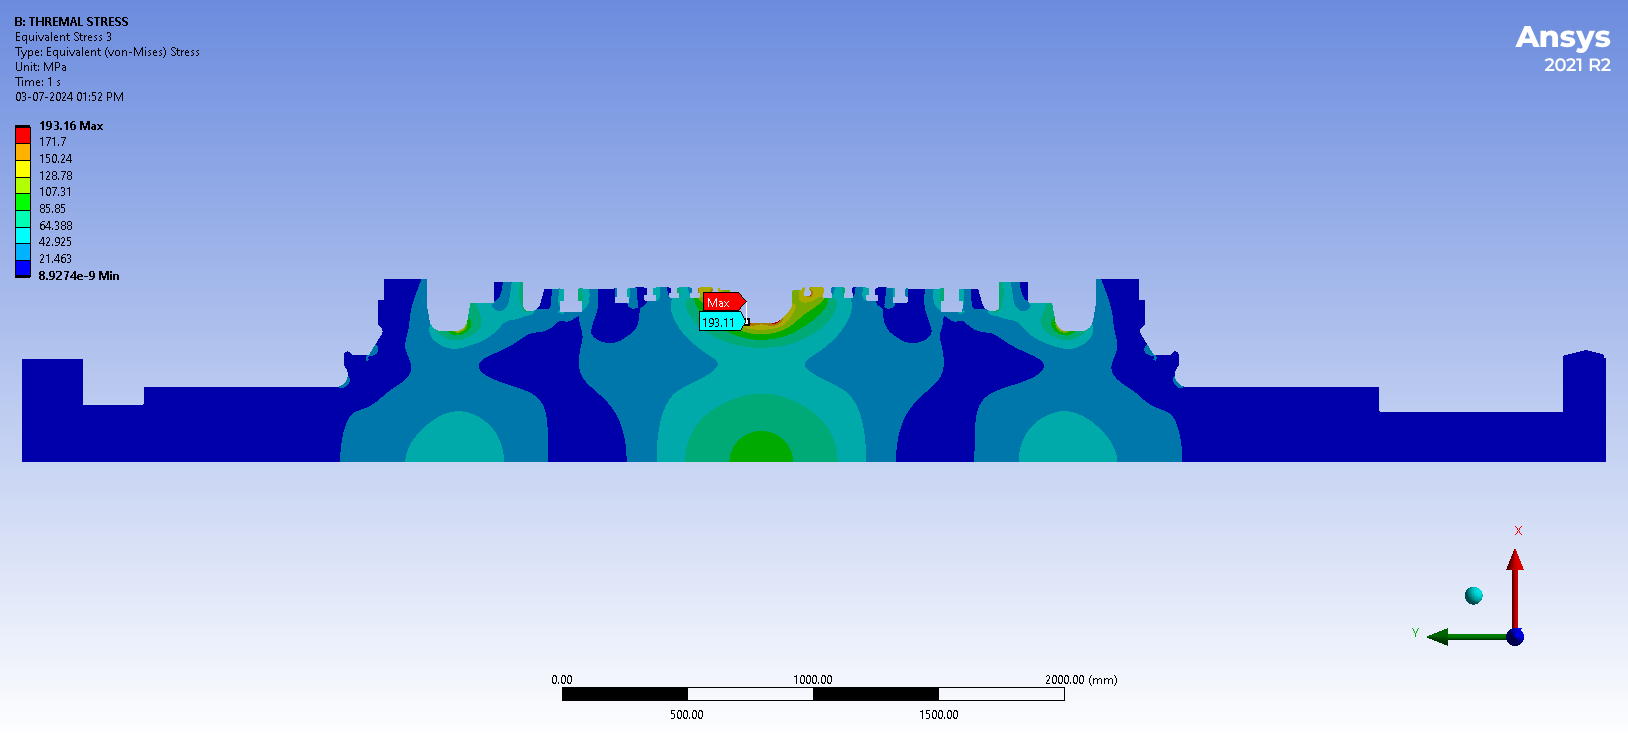
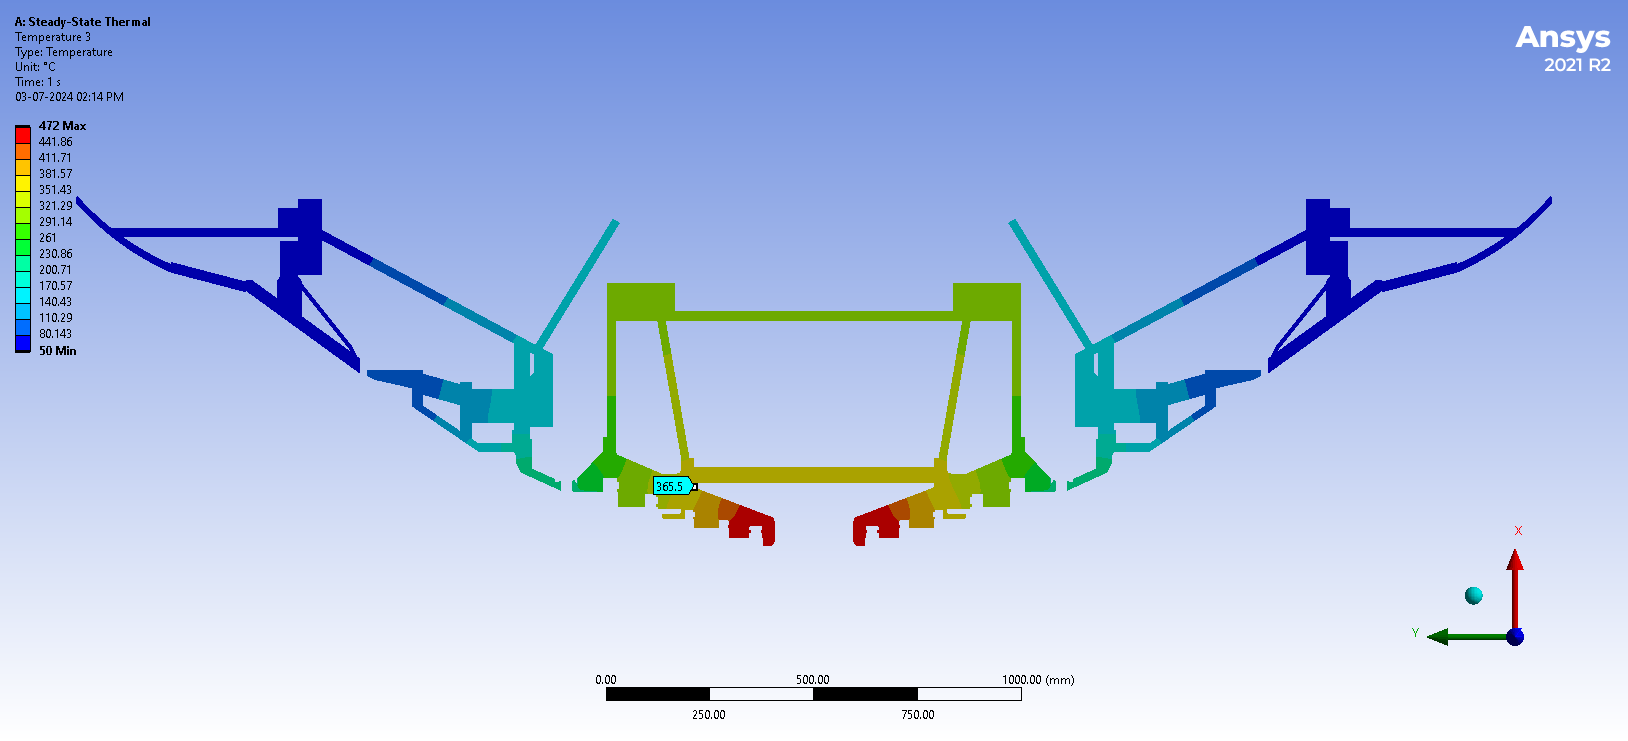
Static Analysis was done by using steady-state thermal to determine creep life of Rotor and Casing of Low Pressure Turbine.
Transient Analysis was carried out by using transient Thermal to determine fatigue life of Rotor and casing of Low Pressure Turbine in cold start, warm start and hot start Conditions.
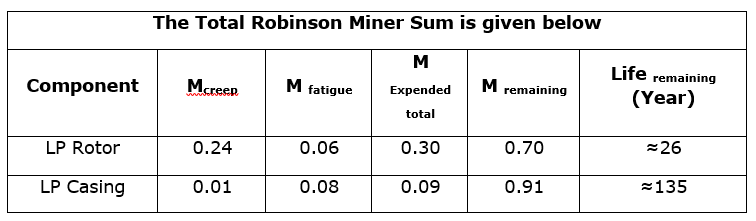
The results obtained from steady-state thermal and transient thermal Analysis of Turbine rotor and casing is used in Robinson-Miner’s formula to calculate remaining life of component as per below table.
Conclusions:
The results of FEA analysis for LP Rotor & Casing show that 30% & 9% of creep and low cycle fatigue life has been expended respectively. The balance life of 70% & 91% of Rotor and casing translates into a useful operational life of another 26 years and 135 years respectively assuming that the machine will be run maintaining similar parameters and stop/ start schedules as done in the past.
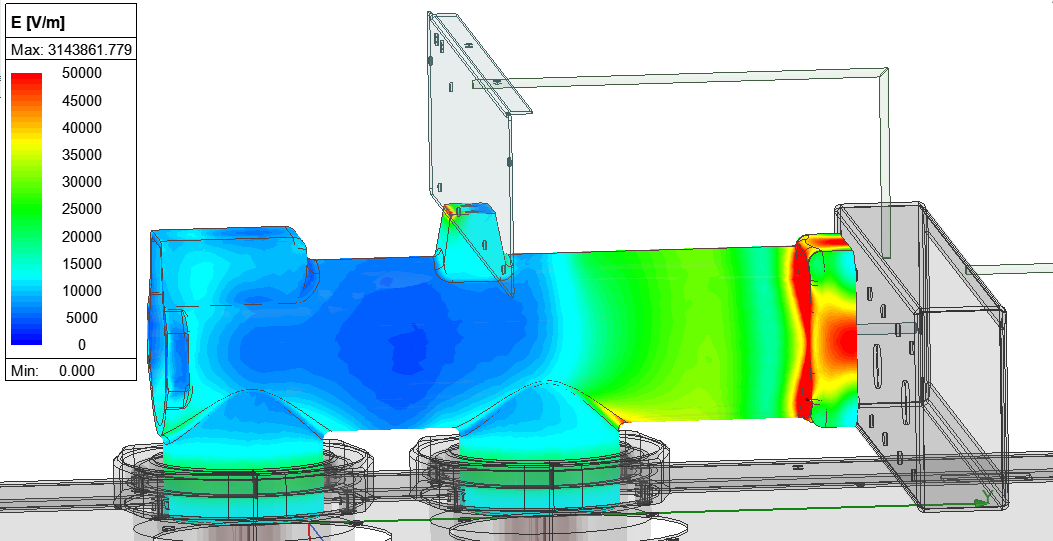
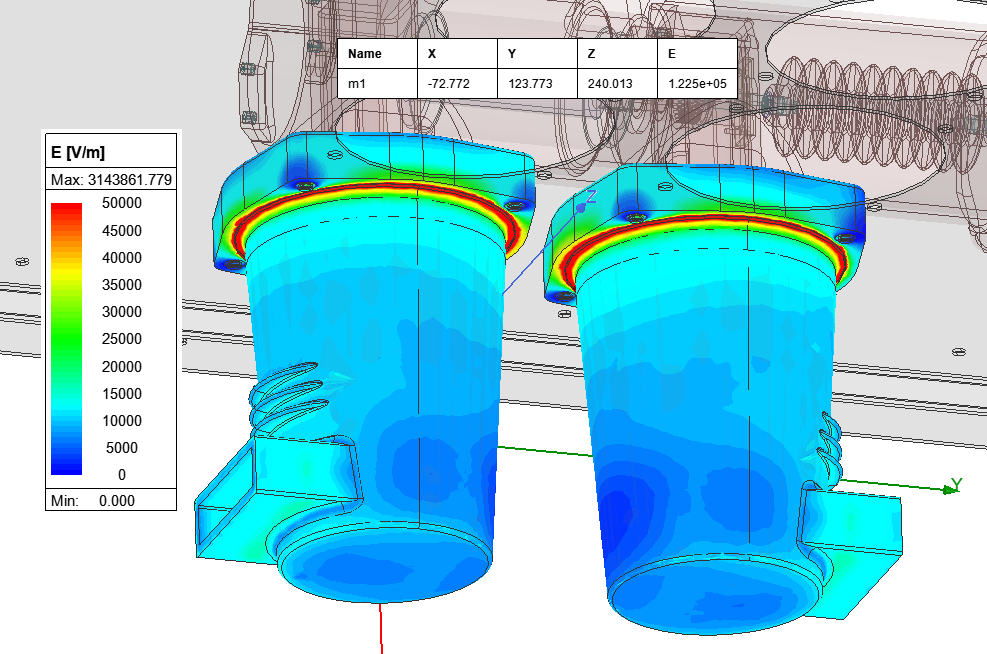
iii) Electrical Field Analysis of 33kV Vacuum circuit Breaker by FEM approach:
A 33 kV Vacuum circuit Breaker Analysis was undertaken for the client by using the Finite Element Method Approach. Specifically, the work involved detailed electrostatic field mapping (Electric Field) at System Voltage, peak Impulse Voltage and Power Frequency Voltage level on Bushing Insulator, Pole Housing and Spout of VCB. ERDA performed this study by using ANSYS Maxwell 3D software and provided the result of Electric field Strength at various locations.
©
Electrical Research and Development Association (ERDA)
.
All rights reserved.
Designed and Developed by
Trizone India